Software
We implement Correlation Spectroscopy concepts to the analysis of images obtained from raster scanning or wide field (Selective Plane Illumination Microscopy) microscopes.
Two methods have been implemented:
Flics
FLICS: FLow Image Correlation Spectroscopy. This novel method allows to extract flow speeds in complex vessel networks from a single raster-scanned optical xy-image, acquired in vivo by confocal or two-photon excitation microscopy. Fluorescent flowing objects produce diagonal lines in the raster-scanned image superimposed to static morphological details. The flow velocity is obtained by computing the Cross Correlation Function (CCF) of the intensity fluctuations detected in pairs of columns of the image. The analytical expression of the CCF has been derived by applying scanning fluorescence correlation concepts to drifting optically resolved objects and the theoretical framework has been validated in systems of increasing complexity. For a detailed description refer to In Vivo Flow Mapping in Complex Vessel Networks by Single Image Correlation. Sironi, Bouzin, Inverso, D'Alfonso, Pozzi, Cotelli, Guidotti, Iannacone, Collini & Chirico. Scientific Reports 4: 7341 (2014) doi:10.1038/srep07341

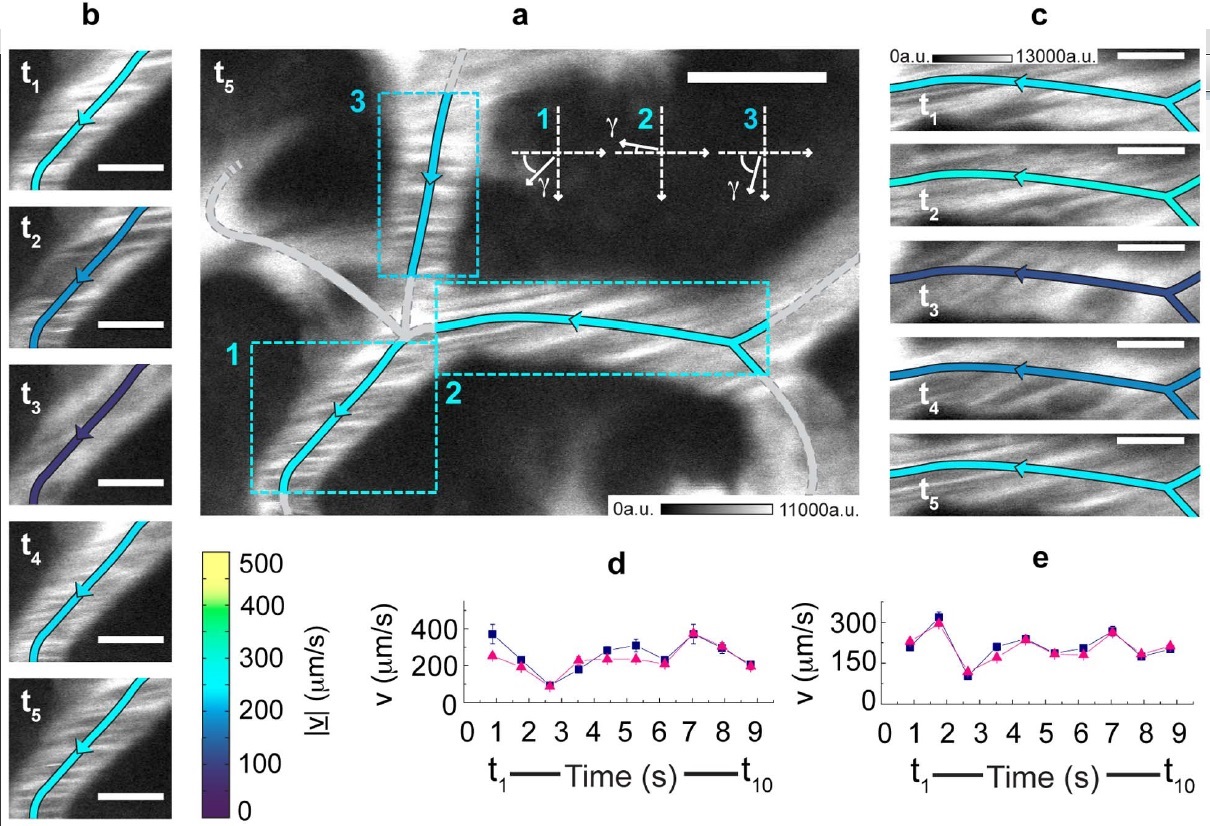
Measurement in time of the blood flow speed in the hepatic microcirculation.
(a) xy-image acquired by detecting the photoluminescence (shown in white) of 5-nm QantumDots. CrossCorrelationFunctions have been derived on the evidenced ROIs and fitted to the FLICS model, leading to |v| 235 μm/s, 256 μm/s and 229 μm/s for ROIs 1, 2 and 3, respectively. A color coding is assigned for the speed |v|, while the arrows indicate the flow direction.
(b), (c) The xy-image in (a) is one out of ten frames of an xyt-stack. The first five frames, each identified by its sampling time, are shown for ROIs 1 (b) and 2 (c).
The same color code of panel (a) is adopted for the centreline. Scale bar, 5 μm; same calibration bar (in arbitrary units) in (b) and (c). (d), (e) Estimates for |v| (triangles) and |v| (squares) versus time in ROIs 1 (d) and 2 (e).
uMAPPS
uMAPPS: Second Harmonic Generation (SHG) is a label-free imaging method used to monitor collagen organization in tissues. Due to its sensitivity to the incident polarization, it provides microstructural information otherwise unreachable by other intensity based imaging methods. We develop and test a Microscopic Multiparametric Analysis by Phasor projection of Polarization-dependent SHG (μMAPPS) that maps the features of the collagen architecture in tissues at the micrometer scale. μMAPPS retrieves pixel-by-pixel the collagen fibrils anisotropy and orientation by operating directly on two coupled phasor spaces, avoiding direct fitting of the polarization dependent SHG signal. We apply μMAPPS to fixed tissue sections and to the study of the collagen microscopic organization in tumors ex-vivo and in-vivo. We develop a clustering algorithm to automatically group pixels with similar microstructural features. μMAPPS can perform fast analyses of tissues and opens to future applications for in-situ diagnosis of pathologies and diseases that could assist histo-pathological evaluation. For a detailed description refer to μMAPPS: a novel phasor approach to second harmonic analysis for in vitro-in vivo investigation of collagen microstructure, F. Radaelli, L. D'Alfonso, M. Collini, F. Mingozzi, L. Marongiu, F. Granucci, I. Zanoni, G. Chirico, L. Sironi Scientific Reports, 7: 17468 (2017)

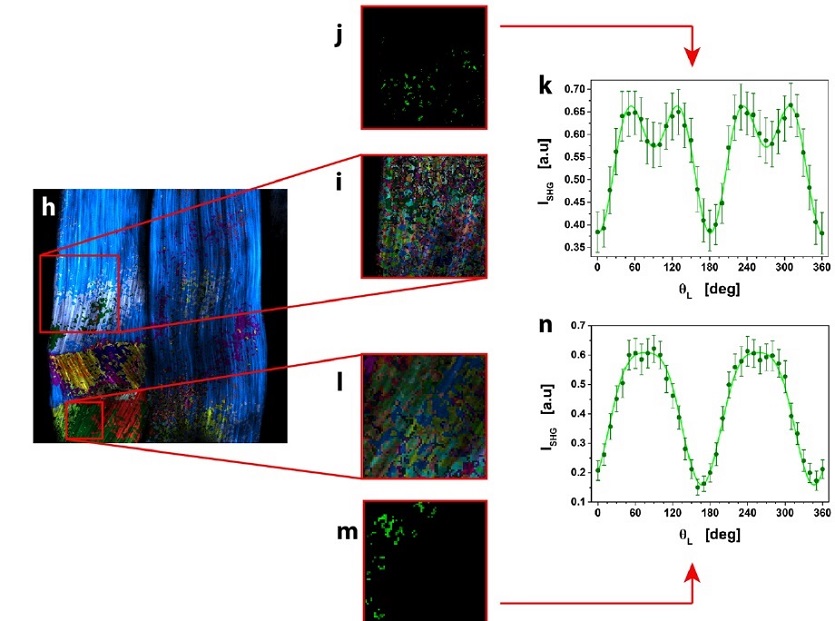
μMAPPS analysis of mouse-tail tendon.
(h) Result of clustering procedure, highlighting the different microscopic behavior in the tissue. 23 clusters were obtained with suitable cutoff values. Each monochromatic LUT encodes for a cluster with an intensity scaling as the pixel integrated Polarization-SHG signal. (i and l) show two ROIs (i: 154 x 154 pixels; l: 69 x 69 pixels) selected from (h) and analyzed with tighter cutoff values to select clusters with more similar microscopic behavior.
One cluster, selected from each ROI in (i) and (l), was reported in (j and m).
The average Polarization-SHG spectrum of the two selected clusters (reported in (k) and (n)) were fit to the MAPPS model equation.